This example conveys the impression that y is caused by x. This may or may
not hold up.
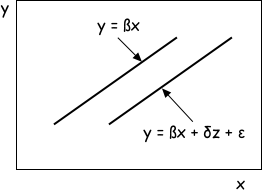
Let’s translate this equation to a graph with x on the horizontal axis and y on
the vertical axis. The error term ε can be thought of an unobservable
factor that shifts the graph of y vs. x.
Economics very frequently discuss observable factors that shift the graph
of y vs. x. Suppose z is such a factor. The multiple regression model to the
left captures this idea. A change in z will change the value of y for a given
x.
* Economists like multiple regression models because they nicely capture the
idea of shifting curves.
Multiple regressions also capture the idea of “controlling for.” In the first
regression above, the value of ß is the effect on y of a 1 unit increase in x.
The the second regression, the value of ß is the effect on y of a 1 unit
increase in x controlling for z. That is, suppose x and z tend to change
together, but we want to think about a policy that changes just x. We need
to distinguish between what happens when x and z change together and when
x changes alone.
* Economists like regressions because they deal with the effect of x on y

EasyMetrics.NET
Easy Econometrics on the NET
William R. Parke